
How This Spread Reading Was Taken · FxPro UAE — FxPro United Arab Emirates 2026
What one captured tick is, why closed-market readings are dropped, and what a median can and cannot promise about your next fill.
Open FxPro Account →A spread is not a property of a price; it is the distance between two prices. Every reading on this page is the gap between the side a sell is filled on and the side a buy is filled on, at a moment in time. Your chart draws one of those two lines and hides the other, which is why the number below is worth reading as a measurement rather than as a fee.
This is the live, hour-by-hour measured spread feed (refreshed daily). For the Standard vs Raw+ cost comparison and fees, see our spreads & costs page.
Measured Raw+ spreads (pips)
| Instrument | Best (min) | Typical (median) | Busy market (p90) | At capture | Ticks sampled |
|---|---|---|---|---|---|
| EUR/USD | 0.1 | 0.2 | 0.2 | 0.2 | 457,098 |
| GBP/USD | 0.6 | 0.6 | 0.6 | 0.6 | 590,492 |
| AUD/USD | 0.2 | 0.4 | 0.8 | 0.4 | 511,715 |
| USD/CAD | 0.1 | 0.4 | 0.5 | 0.4 | 465,429 |
| USD/JPY | 0.3 | 0.3 | 0.5 | 0.3 | 717,421 |
| XAU/USD (Gold) | 15 | 15 | 19 | 15 | 972,676 |
Best = the tightest quiet-market quote we saw; Typical = the median you usually trade; Busy market = the wider spread to expect about 10% of the time (news, rollover, thin liquidity). ‘At capture’ is the live spread at the last reading. Metals such as XAU/USD use a different contract size, so their cash cost is on our gold page. Server FxPro-MT5 Demo, feed 2026.09.15 14:10:41.
Spread through the trading day (measured, last 24h)
| Instrument | Tightest (avg) | Widest (avg) | Worst spike | Through the day |
|---|---|---|---|---|
| EUR/USD | 0.2 (03:00) | 1.782 (00:00) | 9.5 (00:00) | |
| GBP/USD | 0.6 (03:00) | 3.627 (00:00) | 15 (23:00) | |
| AUD/USD | 0.292 (14:00) | 3.98 (00:00) | 25 (23:00) | |
| USD/CAD | 0.292 (09:00) | 2.318 (00:00) | 13.6 (23:00) | |
| USD/JPY | 0.3 (09:00) | 7.082 (00:00) | 16 (23:00) | |
| XAU/USD (Gold) | 15 (09:00) | 75.421 (00:00) | 175 (00:00) |
Table hours are FxPro server time (about UTC+3 / EET); the highlighted guidance above is shown in GST. Average pip spread by hour over the last 24 hours, with the worst single-tick spike. Spreads run tightest in the peak London–New York overlap and widen around the 00:00 server rollover and the thinner Asian hours — the sparkline is each instrument’s daily shape.
What it costs you per lot (Raw+)
| Instrument | Typical spread | Spread cost / lot | Commission (round turn) | All-in / lot | All-in (pips) |
|---|---|---|---|---|---|
| EUR/USD | 0.2 pips | $2.00 | $7.00 | $9.00 | 0.9 pips |
| GBP/USD | 0.6 pips | $6.00 | $7.00 | $13.00 | 1.3 pips |
| AUD/USD | 0.4 pips | $4.00 | $7.00 | $11.00 | 1.1 pips |
| USD/CAD | 0.4 pips | $2.87 | $7.00 | $9.87 | 1.37 pips |
| USD/JPY | 0.3 pips | $1.94 | $7.00 | $8.94 | 1.38 pips |
| XAU/USD (Gold) | 15 pips | $15.00 | $7.00 | $22.00 | 22 pips |
All-in round-turn cost for one standard lot (100,000 units): typical spread × pip value, plus the $7 Raw+ commission ($3.50 per lot per side ($7.00 round turn) on Raw+ and cTrader accounts). On a Standard account you pay a wider spread instead of that commission — see the full spreads and costs page.
Open FxPro Account →Advertised ‘from 0.0’ vs what we measured
FxPro markets Raw+ as spreads ‘from 0.0 pips’ — a best-case floor. Across our sample the tightest EUR/USD quote we recorded was 0.1 pips and the typical was 0.2 pips. That is normal: the ‘from’ figure is a floor you rarely trade on, so judge a Raw+ account by its typical spread and how far it widens under load (the p90 column), not the headline number.
How we measured this
- Recorded on FxPro's own MetaTrader 5 Raw+ account — the broker's real pricing feed, not a third-party estimate.
- Captured in-terminal by an MQL5 expert advisor that logs every tick's bid and ask, so the spread is exactly what the platform shows.
- 3,714,831 ticks across 6 instruments; the figures refresh on a schedule.
- Demo and live Raw+ share the same pricing feed, so these spreads are representative of a funded account.
Spreads are variable and widen around high-impact news and the daily rollover. Past readings do not guarantee future spreads. Last updated 2026-09-15.
The spread is a distance, not a price
Each instrument is quoted twice at every moment: the side a sell is filled on and the side a buy is filled on. The spread is simply how far apart those two are, so it is a measurement of the market rather than a charge anybody sets.
Read that way, the figures below stop being a fee schedule and become a description of conditions — something that varies through the day, tightens when the book is deep and widens when it is thin.
One of the two lines is on your chart
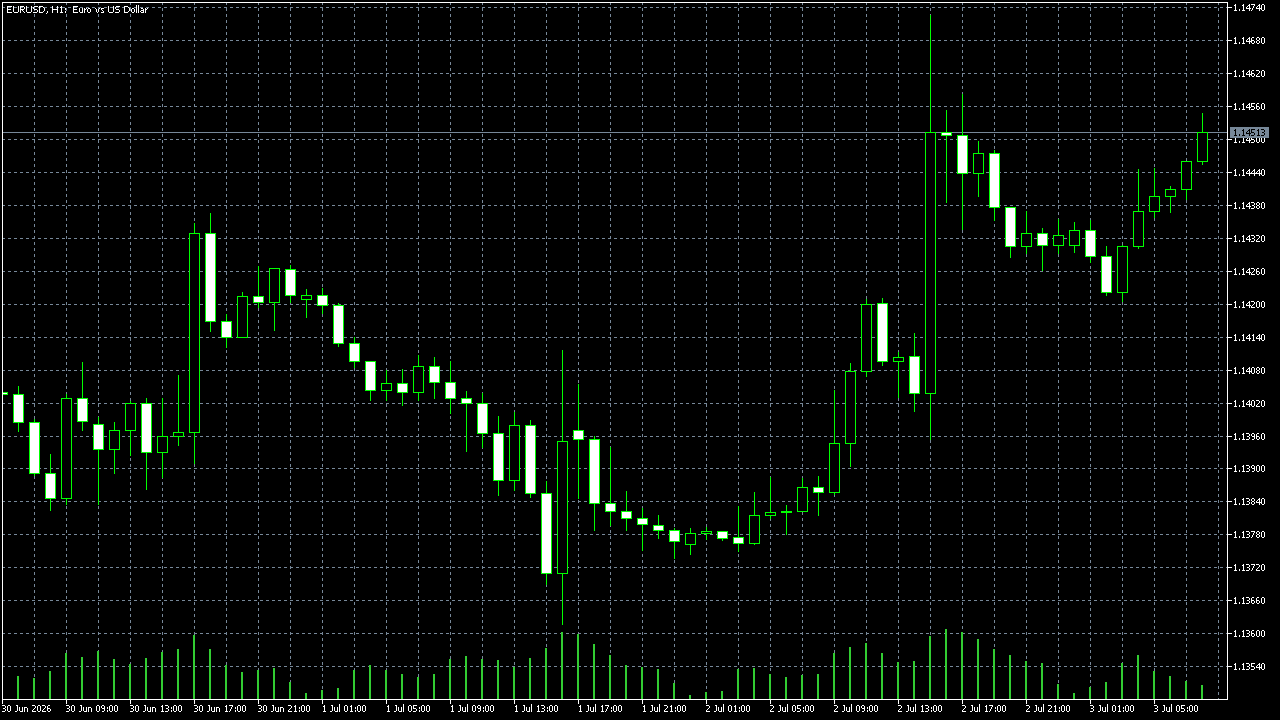
A chart draws the lower side by default, so the number you see and the number a buy will be filled at are never quite the same. Enabling the Ask line puts the second one on screen and makes the distance visible as a band instead of a statistic.
That band is what an order actually crosses. It is also what a stop on a short is triggered from, which is the single most common surprise in a trading journal.
What one captured reading is
Each reading is a quote the terminal received at a moment in time, recorded with its timestamp. Stacking a great many of them gives a distribution, and it is the distribution — not any single tick — that describes the instrument.
Readings taken while the market was closed are dropped, because a closed-market quote is not something anyone could have traded on. A median is published rather than a mean, since short spikes distort an average far more than they distort a middle.
Reading the distance across the symbol list
The spread column in Market Watch shows the same quantity live, for every symbol you have on screen. That makes the whole idea checkable: the table below and your own terminal are measuring the identical distance, just over different periods.
Comparing rows is where the catalogue starts to sort itself. The heavily traded instruments cluster at one end, the long tail at the other, and a symbol you were considering usually declares itself within a session.
Why a short watchlist reads better than a long one
A Market Watch holding hundreds of lines cannot be read; it can only be searched. Four or five rows can be taken in at a glance, and a widening on any of them registers immediately.
So narrowing the catalogue is not about ignoring opportunity. It is what makes the spread column useful at all, because a number nobody looks at is not a measurement in any practical sense.
Watching the same distance in your own terminal
- Open the full symbol list and add only the instruments you actually follow.
- Right-click Market Watch and switch on the spread column.
- Enable the Ask line on each chart so both sides of the quote are drawn.
- Note the contract size from the specification so the distance can be turned into money per lot.
- Watch the same rows at the same hours for a week before drawing conclusions.
- Record the rollover window separately — it is the one part of the day that always looks different.
- Keep the list short enough that you can read every row without scrolling.
Your terminal and the capture behind this page measure the same quantity; the difference between them is the period, the account type and the connection, not the definition.
Reading the two sides in your own terminal
| What to switch on | What it shows | Where it lives |
|---|---|---|
| Spread column | The live distance between the two sides, per symbol | Right-click menu in Market Watch |
| Ask line | The upper side drawn alongside the candles | Chart properties |
| Full symbol list | Every group the account carries, not the default selection | The symbols window |
| Symbol specification | Contract size, volume step and minimum order distance | Right-click a symbol |
| Journal | What the platform did, with times, in order | Terminal window |